How Much Should a Small Business Spend on Marketing in 2026?

Simon Edward • 25 April 2026

This is one of the most Googled questions in business, and the answer most people find is maddeningly vague. "Between 5 and 15 percent of revenue." Thanks. That's a range so wide you could drive a bus through it.


So let's be more specific. Using real data from the two most credible sources in the industry: the Gartner CMO Spend Survey and The CMO Survey.

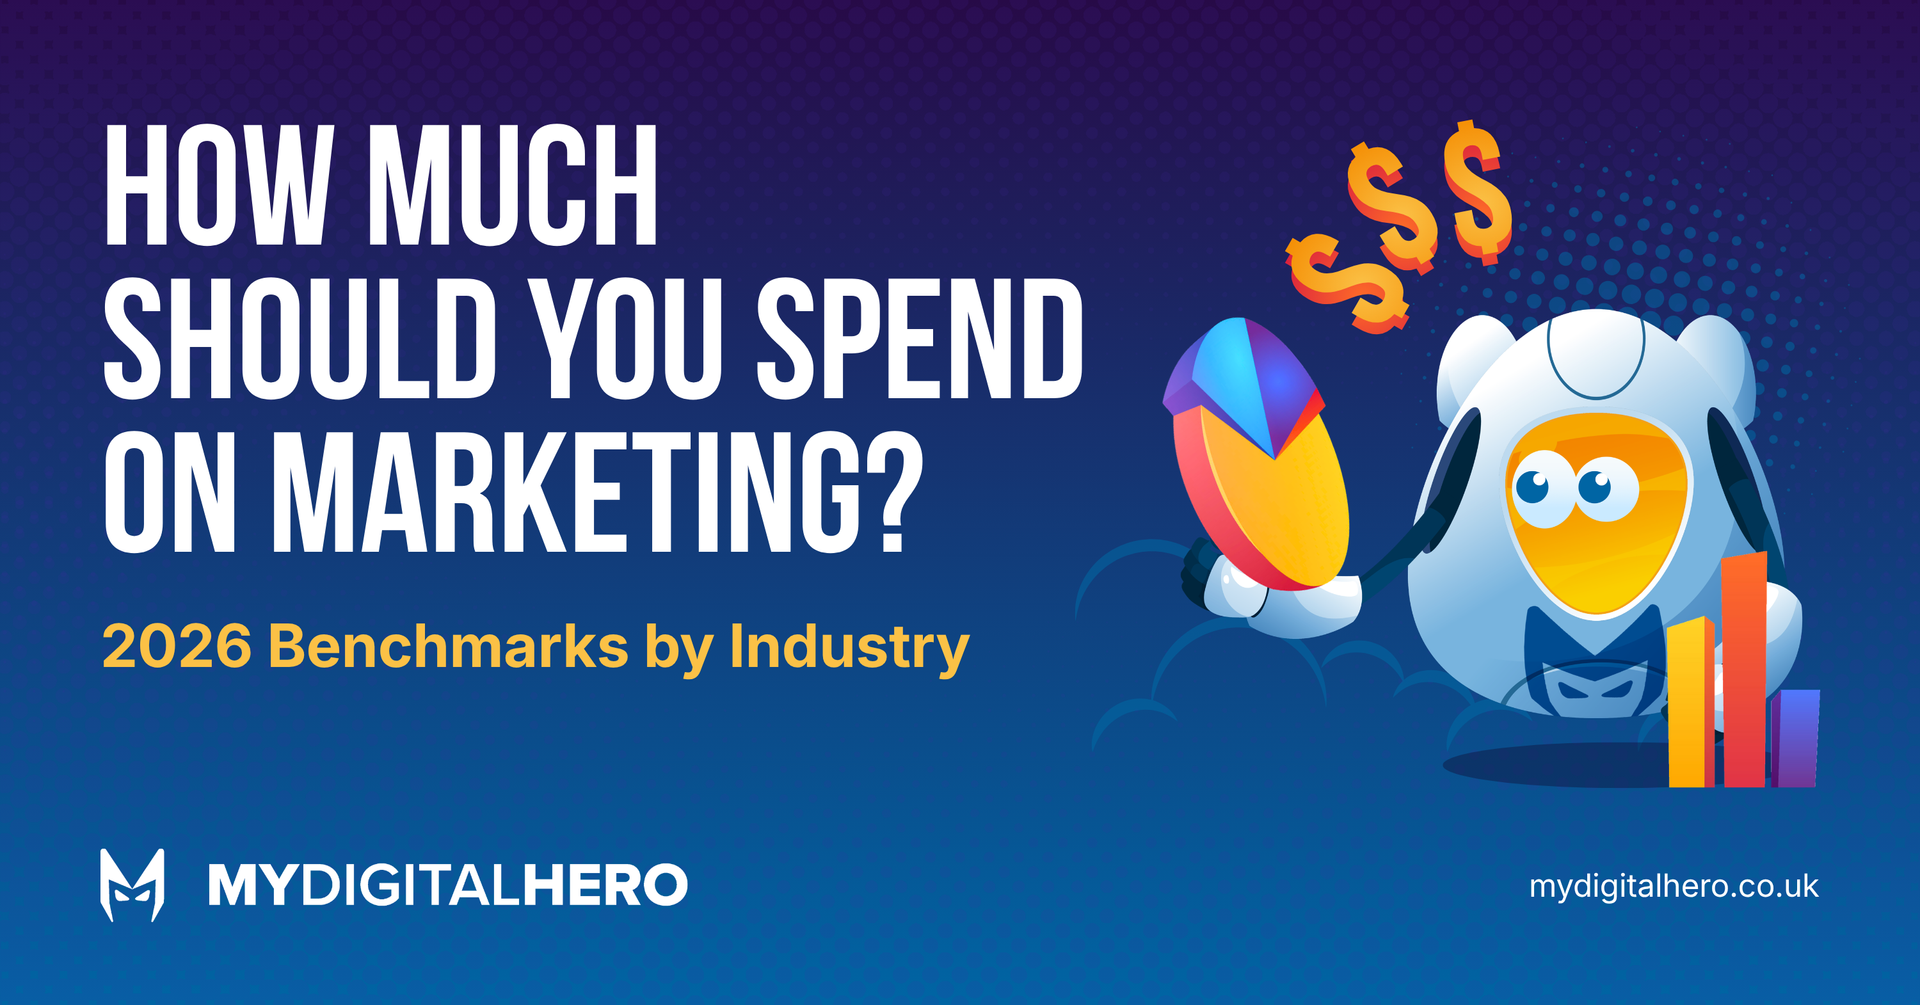
Marketing banner with text “How much should you spend on marketing? 2026 benchmarks by industry” and finance icons.

The Headline Numbers


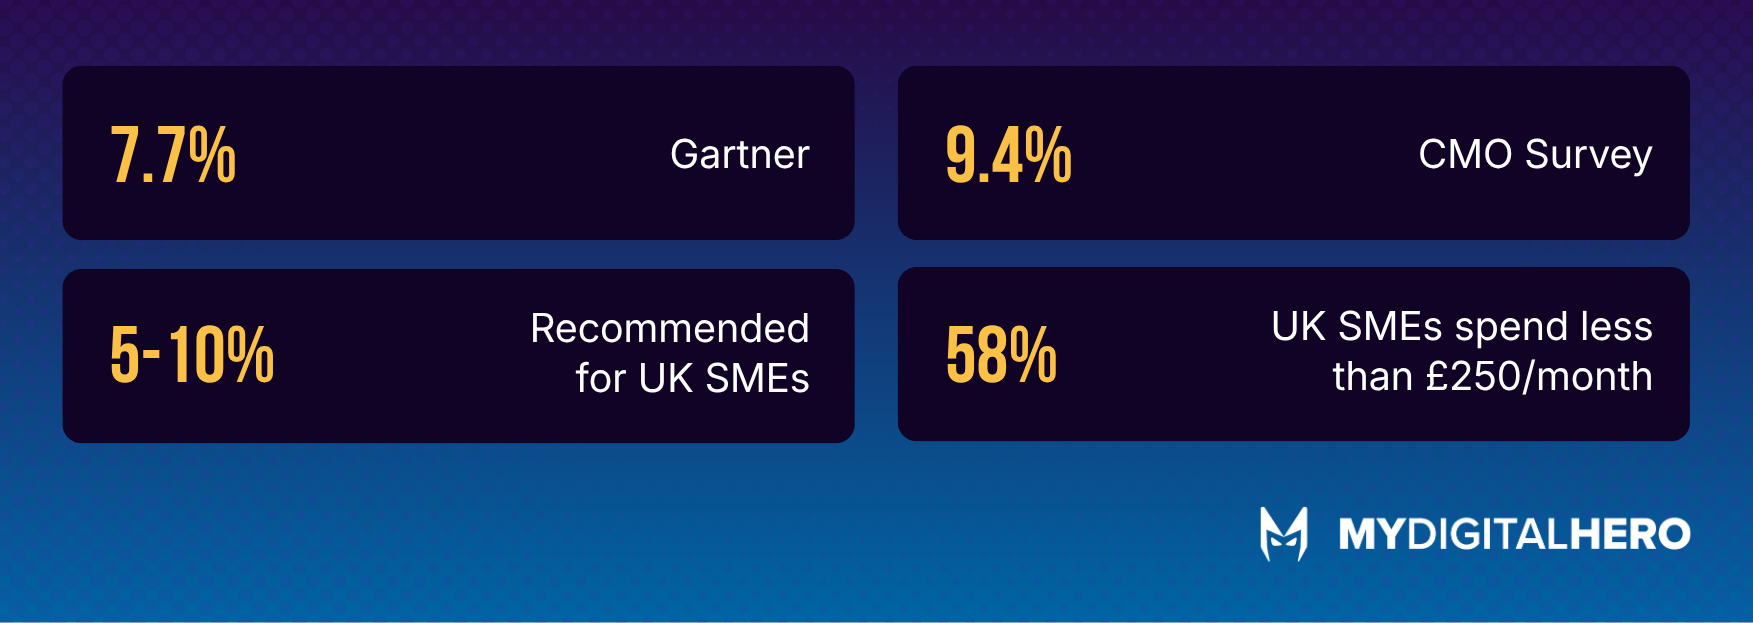
The Gartner 2025 CMO Spend Survey, which surveys marketing leaders at companies predominantly turning over £1 billion or more, puts the average marketing budget at 7.7 percent of company revenue. That figure has been flat since 2024.


The CMO Survey, which covers a broader range of businesses, puts it slightly higher at 9.4 percent of revenue.


For UK SMEs specifically, the recommended benchmark is 5 to 10 percent of annual revenue. But the reality is far worse. Research shows that 58 percent of UK SMEs spend less than £250 per month on marketing. That's £3,000 a year. For most businesses, that's not a marketing budget. That's a gesture.

Blue infographic with four stat boxes showing percentages and labels, plus MYDGTALLERO logo at bottom right

What It Looks Like by Industry


Marketing spend varies significantly by sector. The data shows clear patterns.


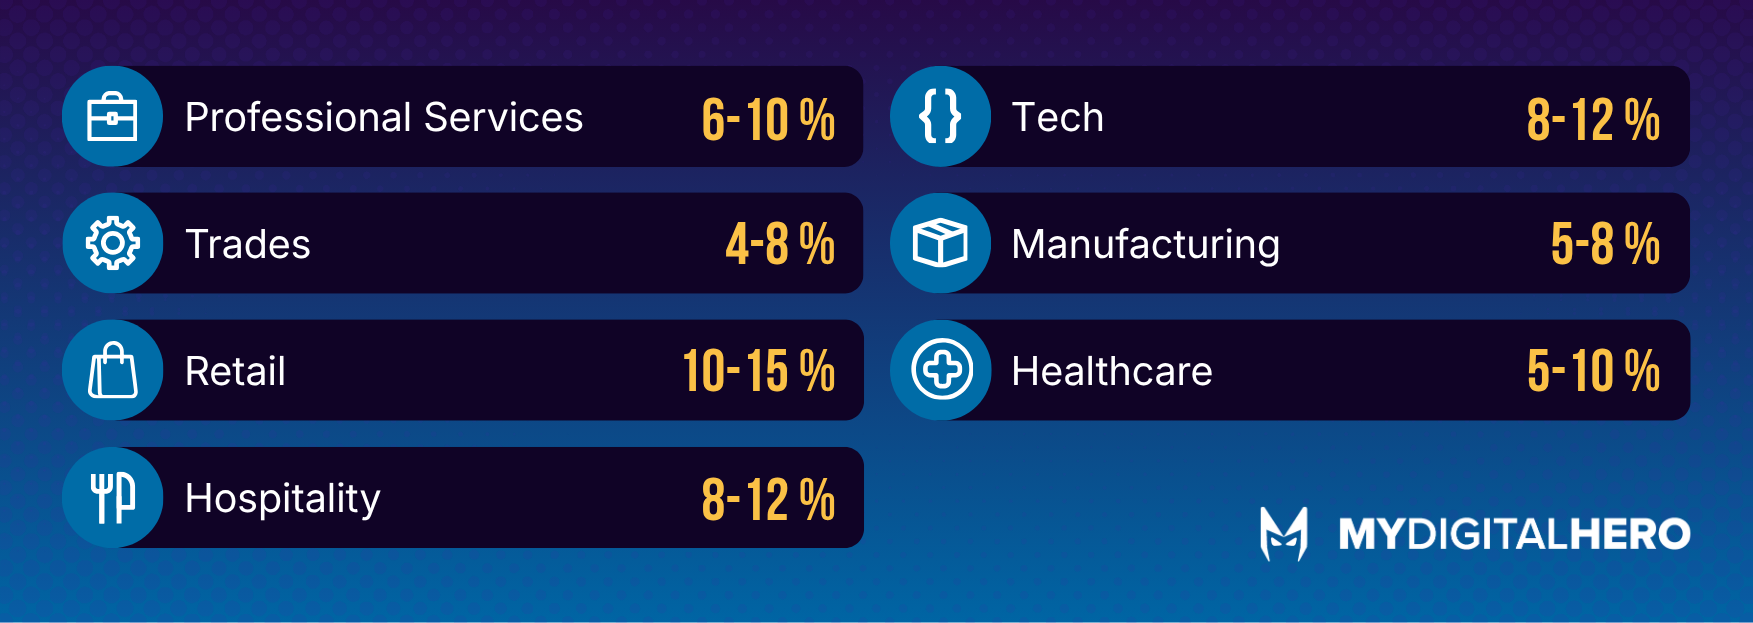
Professional services firms (accountants, solicitors, consultants) typically spend 6 to 10 percent of revenue. The emphasis is on trust-building: thought leadership, content, and credibility.


Trades and construction businesses tend to spend 4 to 8 percent. Traditionally reliant on word of mouth and referrals, but the businesses winning new contracts are increasingly the ones visible on Google.


Retail and ecommerce is higher at 10 to 15 percent. The competition for attention is fierce and the buying cycle is short, so more budget goes to paid advertising and content.


Hospitality, leisure, and tourism sits at 8 to 12 percent. Seasonal demand, high competition, and the need for consistent visibility drive the spend.


Tech and software companies spend 8 to 12 percent. Customer acquisition in SaaS and tech requires sustained investment in content, SEO, and paid channels.


Manufacturing and wholesale is lower at 5 to 8 percent. More reliant on direct sales and trade relationships, but digital lead generation is growing rapidly in this space.


Healthcare and wellness ranges from 5 to 10 percent, with newer practices often needing to push toward the higher end to build patient bases.

Blue infographic listing professional services, trades, retail, hospitality, tech, manufacturing, and healthcare with percentages.

The Hidden Cost Nobody Counts


Here's the number most business owners don't calculate. How many hours a week do you personally spend on marketing? Writing social posts, updating the website, tweaking a Google Ad, replying to reviews, thinking about that blog you keep meaning to write.


If you're a business owner spending five hours a week on marketing tasks and your time is worth £50 an hour (a conservative estimate for someone running a business turning over £500k or more), that's £12,000 a year of your time.


That's not free marketing. That's expensive marketing done by someone who should be running the business.

When we built our Marketing MOT tool, we included an "Owner's Time" calculation specifically for this reason. Most people who complete it are shocked by the number.


What Does Good Marketing Actually Cost?


Let's make it practical. A business turning over £1 million with a 7 percent marketing budget has £70,000 a year to spend. Roughly £5,800 a month.


For that, a well-structured marketing programme should cover a modern, conversion-focused website, ongoing SEO, regular content creation, paid advertising with proper management, email marketing, and social media presence.


Our Hero+ subscription covers all of this for £2,499 per month. That's an annual investment of roughly £37,500, which is comfortably within the recommended range for most businesses turning over £750,000 to £2 million. And it replaces what would otherwise require hiring at least one full-time marketing executive, plus freelancers, plus tools, plus management oversight.


The Cost of Spending Nothing


The most expensive marketing budget is zero. Not because of what you spend, but because of what you miss.

Every month without SEO is a month your competitors are building rankings you'll have to fight harder to overtake. Every month without content is a month with no new reasons for anyone to visit your website. Every month without paid ads is a month of leads going to whoever is visible instead.


The compound effect works both ways. Invest consistently and the results build on each other. Do nothing consistently and the gap gets harder to close.



Blue ad banner reading “SCORE YOUR MARKETING” with a yellow “FREE” burst and a cartoon superhero logo on the right

Check Where You Stand


We built the Marketing MOT to help business owners see exactly where their marketing stands. It scores your marketing out of 100 across eight categories, reveals the hidden cost of your own time, and shows how you compare to industry benchmarks.


No email required. No sales pitch. Just an honest score and some clarity on where you're at.

Share this article

Recent Posts

SEO explainer graphic with Google search bar, upward arrows, and a cartoon robot on a blue background
by Simon Edward 25 April 2026
Understand SEO & its impact on your business. Get key strategies for success. Contact My Digital Hero for expert support!
Tech Stack Graveyard poster with a blue robot among tombstones on a purple night background
by Simon Edward 25 April 2026
Explore our interactive graveyard for dead tech like Adobe Flash & Internet Explorer. Join us in remembering the tech that shaped the web!
Infographic comparing native app, web app, and website with colorful circles and a cartoon robot mascot
by Simon Edward 25 April 2026
Understand the differences between native apps, web apps & websites. Choose the right solution for your business needs today!
Blue infographic with a cartoon owl and six coin icons, titled “The 6 Types of Business Owner We Meet.”
25 April 2026
Identify 6 business owner types & discover how a marketing partner can boost your growth. Contact us for tailored solutions!
Blue marketing infographic with the title “10 Reasons Not to Do Marketing” and a cartoon character holding a 10 sign
by Simon Edward 25 April 2026
Explore why avoiding marketing is harmful for businesses. Contact us to enhance your marketing strategy today!
Abstract multicolor gradient background in green, blue, and purple tones
by Simon Edward 25 April 2026
Avoid costly app development errors by defining your project clearly. Invest in a thorough discovery phase for success.